Back to Clickhouse
We were very happy with what we achieved using InfluxDB, its easy use of timeseries was very helpful in our work of trends, machine learning and stats.
However, using InfluxDB there is a query that we cannot ask: who was the IP that asked for a given domain query? the relationship IP-domain has a high cardinality so the engine died very often.
Thus, we decided to go back to our own recommendation from Usenix SRECON 2018 and use a ClickHouse column database to store the queries and materialized views to produce aggregations.
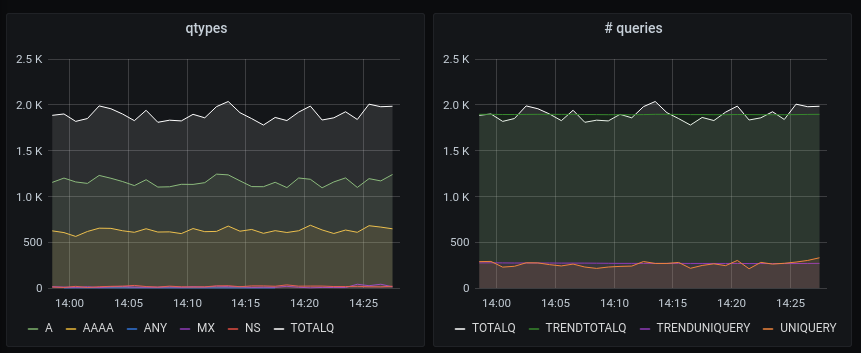
Now, after install ClickHouse on your servers, write cat tables.sql | clickhouse-client --multiquery to create the database schema, and use grafana to watch the aggregations, for instance, the sum of queries by type on a time span will be:
SELECT t, Type, sum(c)

FROM $table

WHERE $timeFilter

GROUP BY t, Type
ORDER BY t, Type